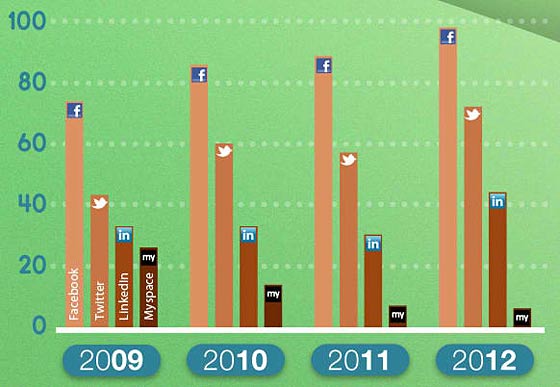
Results of 2012 Nonprofit Social Networking Benchmark Report, with infographic
Target audience: Nonprofits, foundations, NGOs, cause organizations, Web publishers, educators, journalists, general public.
Guest post by Frank Barry
Blackbaud
 Blackbaud, the Nonprofit Technology Network and Common Knowledge have just released the fourth annual 2012 Nonprofit Social Networking Benchmark Report.
We learned a lot of things, but one prevailing theme stood out: Despite limited budgets and staffing, nonprofits continue to find great value in their fast-growing social networks.
The report is packed with insights into how nonprofits are leveraging social networks as part of their marketing, communications and fundraising strategies. Have a look at the infographic below, and then download the full report to learn more about important behaviors and trends.
6 key findings from the report
- 98% of the nonprofits surveyed have a Facebook page with an average community size of over 8,000 fans. (The nonprofits tended toward the mid- and larger size organizations.)
- Average Facebook and Twitter communities grew by 30% and 81%, respectively.
- Average value of a Facebook Like is estimated to be $214.81 over 12 months following acquisition.
- 73% allocate half of a full time employee to managing social networking activities.
- 43% budget $0 for their social networking activities.
- The top three factors for success are: strategy, prioritization, dedicated staff.
Nonprofit social networking infographic
Check out this Nonprofit Social Networking Infographic based on the 2012 report to get high level insight into the findings as well as a few year over year trends.
View large version if you prefer (yes, it gets larger).

Don’t forget to download the complete 2012 Nonprofit Social Networking Benchmark Report.
And tell us if you agree or disagree with the conclusions or the findings.
Related
• See Socialbrite’s compendium of free reports for nonprofits
• Free social media reports


