Stats that you should measure before revamping your tactics
 If you want your website to increase the number of email subscribers and new donors on your website, you first have to know what’s currently working (or not) on your website. The best tool for the job is Google Analytics.
Here are five important stats to measure with Google Analytics:
Visits

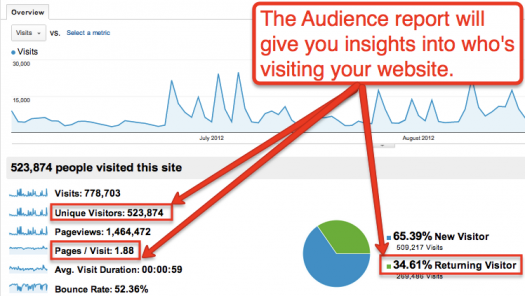
1The audience report in Google Analytics will show you how many visits your website is receiving within a specific time period. This report will tell you how well your social media, search engine optimization (SEO) and other marketing strategies are working. But getting visits is just the beginning.
People

2Within the Audience report, you can learn more about who’s visiting your website, how recently they’ve visited, how often they return, and how many of them are new visitors.
Sources

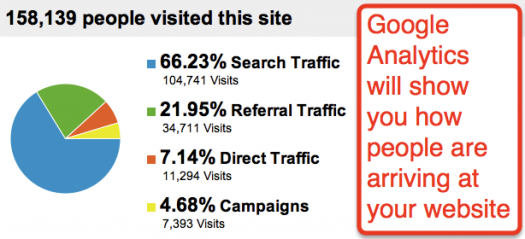
3In Google Analytics, the Traffic Sources Overview will tell you how people are getting to your website. Are they finding you mainly through search? Through referral traffic? Or do they visit directly?
You can drill down into these sources for more details, and then develop strategies to get the most out of each referral source.
Pages

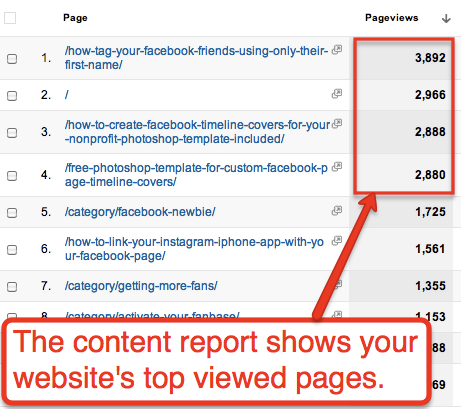
4The content reports will help you understand which topics people are most interested in on your website. These pages can (and should) be tweaked to increase new email subscribers, new donors or whatever other conversion goal you have for your website.
You also want to analyze what pages people enter on your site, and which pages they exit. Ultimately, you want some of your top exit pages to be the ones people hit after they join your email list or make a donation.
Social sources
5Google Analytics includes a set of new reports that show where people engage with your content. You’ll be able to see what people are saying in each social network, and learn what type of content works best for each network.
Learn more about Google Analytics
Obviously there’s a lot more to Google Analytics than what you’ve just read. As a next step, check out Google’s getting started webinar below, or sign up for a CharityHowTo webinar — including The Power of Metrics, coming up Oct. 10 by my partner JD Lasica.
John Haydon delivers social web strategy solutions for “the quick, the smart, and the slightly manic.” Curious? Then visit the John Haydon blog, follow him on Twitter or leave a comment.
 This work is licensed under a Creative Commons Attribution-NonCommercial 3.0 Unported.


Nice summary. I’ve been helping nonprofits for many years use Google Analytics and since it is an ocean of information, this is a great place for folks to start – and the ones to concentrate on. I think looking at both the top and bottom content is helpful information to see what content is working and what is not. Also a good job for an intern or volunteer is to visit those traffic sources to make sure they have accurate information about your organization!
I have also been looking at average cart abandonment value. This allows you to see if there is anything wrong with your pricing and shipping model. Running tests with different values of free shipping after $x allows you to find a good balance of free shipping and average order value.
A newer feature to Google Analytics is “Social Sources”.
@Conversion tool Yes, I’ve seen that. And agree folks should be checking on the main social referrers.