How nonprofits can use infographics to demonstrate supporters’ impact
Target audience: Nonprofits, NGOs, cause organizations, social enterprises, businesses, Web publishers, bloggers, social media managers, individuals.
 People support your organization for one reason: They view your organization as the agent of change they seek.
If they had the resources, they’d make the changes they desire by themselves. But they don’t, which is why you’re in their lives.
So when you tell the story of your cause, you need to show how supporters ultimately create the outcomes.
Nonprofit storytelling with infographics
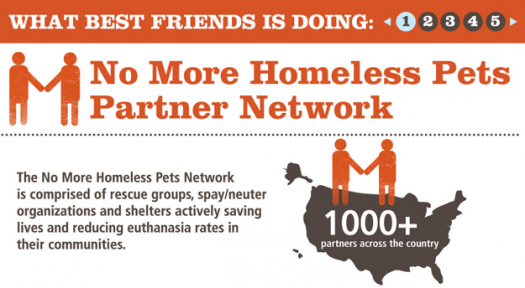
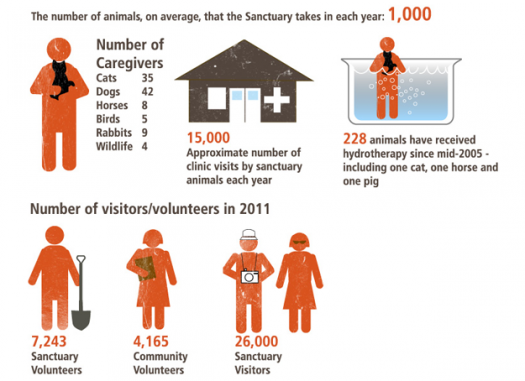
One powerful way to do this is with a set of infographics like the Best Friends Animal Society created.
What’s really great about this infographic is that it’s broken down into five separate infographics, which makes the information even more digestible.

Five tips for creating powerful infographics
Best Friends Animal Society does a number of things right with their infographic. Here are a few:
- Keep it simple. The information should be instantly understood through pictures and words.
- Make it beautiful. No one wants to share an infographic that’s ugly. Make sure you spend the money and hire a graphic artist who can create a beautiful infographic. (Here are 20 tools to create infographics, including our favorite, Canva.)
- Make it easily shareable. Users should be able to share your infographic with one mouse click on Pinterest, Facebook and Twitter. If you use WordPress for your website, you’ll find a number of plug-ins that will add a sharing feature to images.
- Put it everywhere. Make sure you post your infographic on your Facebook page, your Pinterest board, and even Instagram. This allows people who call these places their home to easily see it.
- Promote it. Just because you build it doesn’t mean people will come. You need to have a marketing communications plan that uses your biggest assets, like your email list, to promotes the infographic.
Have you seen an effective infographic about a cause? Let us know in the comments section below!
John Haydon delivers social web strategy solutions for “the quick, the smart, and the slightly manic.” Curious? Then visit the John Haydon blog, follow him on Twitter or leave a comment.
 This work is licensed under a Creative Commons Attribution-NonCommercial 3.0 Unported.


Thanks for our tips. I just created my first infographic at https://s3.amazonaws.com/easel.ly/all_easels/71082/35_Top_Etsy_Sellers/image.jpg
@tonysellertools Infographics have definitely become democratized!