Photo courtesy of cambodia4kidsorg via Creative Commons
Break out analytics into five separate reports
Target audience: Nonprofits, cause organizations, foundations, NGOs, social enterprises, businesses, Facebook administrators.
 Facebook Insights for Pages provides critical data about activity around your Page and your Page updates. It’s like a GPS device guiding you towards successful interactions on Facebook.
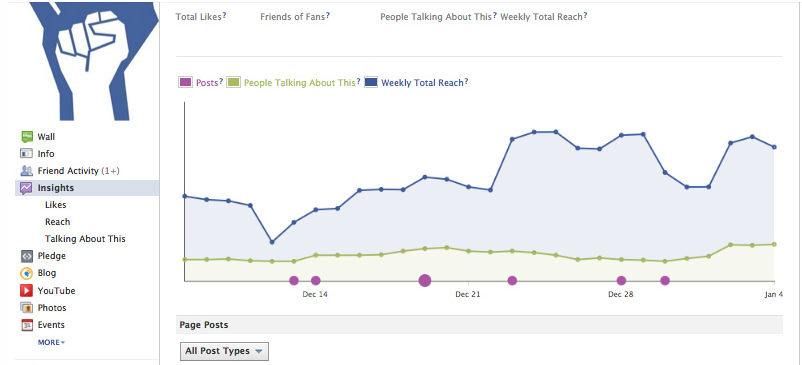
Facebook breaks down its analytics into five reports that can be viewed directly on your page:
- The Overview Report: An overview of how your page is performing day to day, with sortable post-level details.
- The Likes Report: A report about the Facebook users who like your page.
- The Reach Report: A report about the Facebook users who see your page content (organic, viral and paid reach), what websites are referring traffic to your page and more.
- The Talking About This Report: A report about the Facebook users who create content about your page, and how those stories generate viral reach.
- The Check Ins Report: A report about the Facebook users who check in to your Facebook Place on their mobile device.
Going beyond Facebook Insights
The five reports listed above provide more than enough data to navigate toward most destinations. However, there are times when you want deeper insights around your page. That’s why Facebook allows you to do a full data dump (up to an 89-day range) of all your Insights data.
Following are examples of some of the data unavailable in the standard Insights reports that you can view by exporting data:
Page level data:
- The number of people each day who saw your page content
- The number of people each day who engaged with your page
- The number of people each week who engaged with your page
- The number of stories each day created about your page
- The number of stories created about your page over the past 28 days
- The number of people each day who liked your page who are also friends with current fans
- A breakdown of how people have liked your page each day (through a Like Box, on the page, in a hover card, etc.)
- The number of people each day who saw your page or its posts from a story published by a friend
- Data on post impressions. Impressions are the number of times a post is displayed, while reach is the number of people who saw those posts.
Post level data:
- Date and time an update was published
- The number of people who saw your post in a story from a friend
- The total number of impressions each post received
- The number of people who gave negative feedback on your post
- The number of people who hid your post
- The number of people who reported your post as spam
- The number of fans who saw your post
- The number time your post was displayed to fans
- The number of stories about your post by fans
How to export your Page Insights

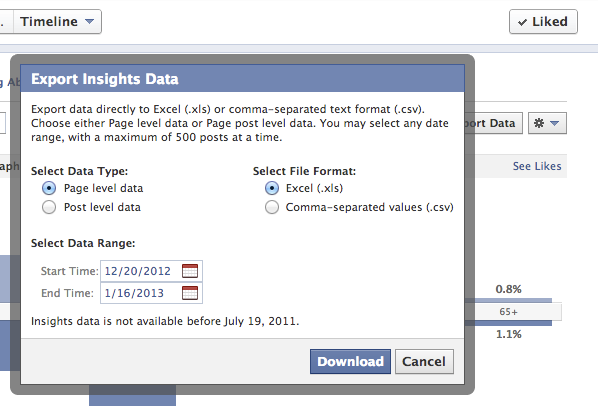
You can export either page level or post level data from your Page Insights simply by clicking the Export button on the top-right corner of any of your Insights tabs, and selecting page level or post level data, the date range you want to analyze and the format for your export (as shown above). Insights data is not available before July 19, 2011.John Haydon delivers social web strategy solutions for “the quick, the smart, and the slightly manic.” Curious? Then visit the John Haydon blog, follow him on Twitter or leave a comment.
 This work is licensed under a Creative Commons Attribution-NonCommercial 3.0 Unported.


