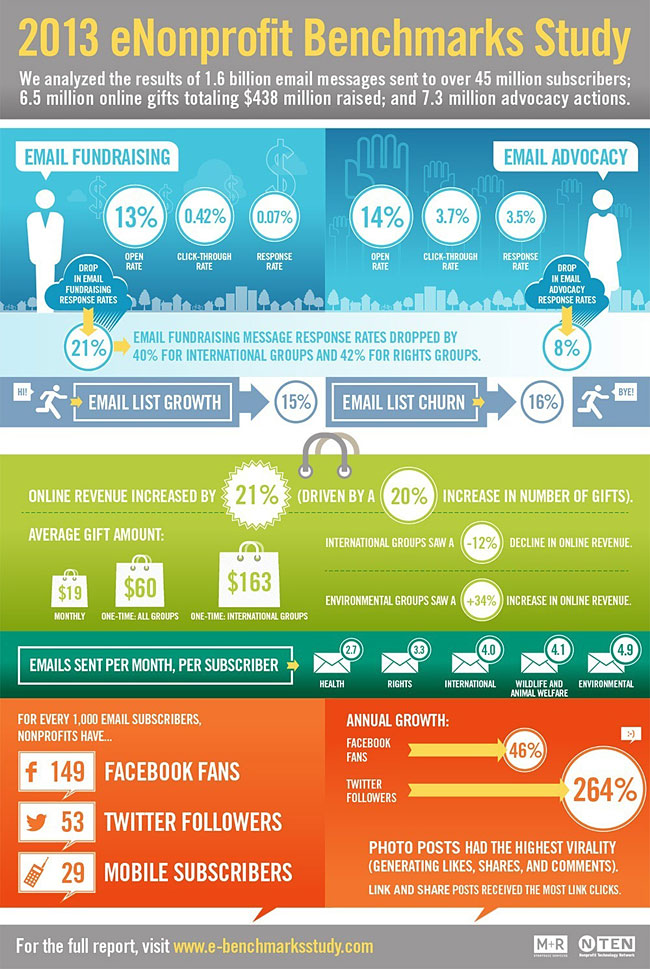
Highlights of 2013 eNonprofit Benchmarks Study (infographic)
This is the second of two articles on NTC 2013. Also see:
• Highlights of 2013 Nonprofit Technology Conference
Target audience: Nonprofits, cause organizations, foundations, NGOs, social enterprises, educators, journalists, general public.
 Every year, Socialbrite takes a look at the annual study of online nonprofit trends put out by the communications firm M+R Strategic Services and the Nonprofit Technology Network. This year, we waited a couple of weeks after the report’s release to hear directly from Madeline Stanionis, creative director of M+R, who dissected the annual survey of the nonprofit sector at last week’s Nonprofit Technology Conference in Minneapolis.
The 2013 eNonprofit Benchmarks Study offers the sector’s only in-depth look at how nonprofits fared with email marketing, online fundraising and nonprofit advocacy over the past year. The report studied data from 55 generally large nonprofits in the environmental, health, human rights, international and wildlife and animal welfare sectors. As I’ve said in the past, a study of 55 large organizations — which sent 1.6 billion emails to 45 million list subscribers and raked in more than $438 million online donations during 2012 — is hardly representative of the 1.5 million mostly small nonprofits in the United States. Still, the trend lines are worth examining.
Here, then, are a few of the top-line takeaways:
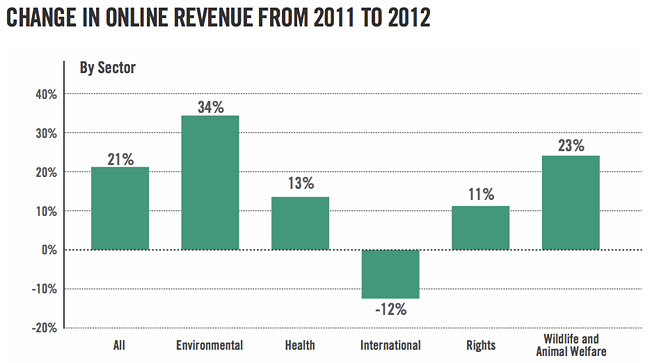
- Online revenue was up 21 percent last year. One-time gifts continue to make up the bulk of online giving, with monthly giving programs across all groups bringing in 43 percent more revenue than the previous year.
- The average monthly gift was $19, while the average one-time gift was $60.
- Twitter had a big year. Nonprofits began paying serious attention to their social channels, and their Twitter followers increased by 264 percent in 2012.
- But perspective, people: For every 1,000 email subscribers, participating nonprofits reported just 149 Facebook followers and 53 Twitter followers.
- Email had a Jekyll and Hyde year. Subscriber lists grew by 15 percent. And open rates remained steady at 14 percent overall.
- But email response rates — the percentage of people who responded to a call to action — were way down. Click-through rates for all sectors stood at 1.7 percent (down 22 percent), and fundraising message click-throughs stood at 0.42 percent (down 27 percent).
Infographic shows email, social media trends at a glance
You can download a PDF version of the study at e-benchmarksstudy.com. Here’s an infographic that summarizes some of the findings:
“The world is changing,” Stanionis told the packed room. Some 33 percent of online donations to nonprofits come from email (down from 35 percent last year). I asked about the 67 percent that doesn’t come from email solicitations — how much of that is from social media? M+R and NTEN don’t know, partly because reporting of online donations is hard to track in a reliable way. (Next year, folks? Please? Please?)
Secrets from the Obama campaign
Stanionis shared these surprises from Obama’s new media staff about what worked — and what didn’t — during the most successful online fundraising campaign in history:
- Segmentation based on donor behavior is the only fundraising segmentation worth doing. Donor behavior turned out to be far more significant than demographics, past history and the like.
- Novelty works, until it doesn’t. “Try new stuff,” Stanionis advised. “But you may have a short lifespan of only two weeks before it gets old.”
- Short emails. Long. Whatever. No patterns were discernible.
- The same email sometimes elicited the highest donation rates — and the highest unsubscribe rates. “Push the envelope to elicit emotion and responses. Touching a nerve is a good sign,” she said.
Some final lessons learned
Participating nonprofits also saw a healthy spike in their Facebook fans — a 46 percent increase over the previous year. Nonprofits posted about once per day on Facebook, though larger organizations posted more frequently. Photo posts were the most popular content for users to like, share or comment on. But photos were ineffective at driving people to webpages beyond the confines of Facebook.
The median number of Facebook fans, across all nonprofit sectors, was 35,538, which tells you only that the survey is skewed toward larger organizations. The median number of Twitter followers? 21,788 or, again, probably far more than your organization has.
Interesting factoid shared by one of the attendees, who works at Edutopia: “This year for the first time, our website’s referral traffic is pulling in more visitors from Twitter than from Facebook. And we spend a lot more time on Facebook than on Twitter.”
There are tons of interesting datapoints in the study. Download it and check it out for yourself. JD Lasica, founder and former editor of Socialbrite, is co-founder of Cruiseable. Contact JD or follow him on Twitter or Google Plus.
 This work is licensed under a Creative Commons Attribution 3.0 Unported.


Thanks so much for this recap, JD. I’ve arranged for someone from the Obama re-election campaign to speak with the NTEN Communities of Impact program participants in a few weeks, and this made me even more excited to soak up her wisdom!
@communityjulia Cool, Julia. Not surprising that the Obama team is still on the ball!