Target audience: Nonprofits, cause organizations, foundations, NGOs, social enterprises, businesses, educators, Facebook page administrators.
 The great thing about Facebook is that what works and what doesn’t work can be measured very specifically. And there’s probably nobody more experienced in the science of social media than Dan Zarrella.
Dan recently published an infographic based on more than 1.3 million Facebook updates from the top 10,000 pages.
Here are a few things that stand out:
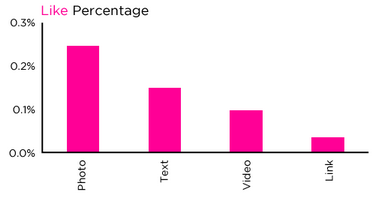
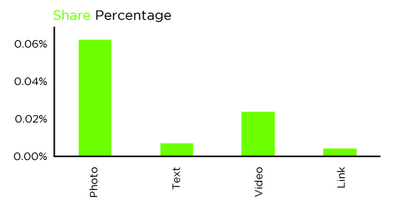
Photos get the most likes and shares
On your Facebook Page, you can publish updates, videos, photos and links. Of these four type of content, photos get the most likes and shares (as shown below).


Positive or negative is better than neutral
Facebook users want you to pick a side. Take a stand! For or against!
As shown below, posts with a high positive sentiment get more likes, while posts with a high negative sentiment get more comments.

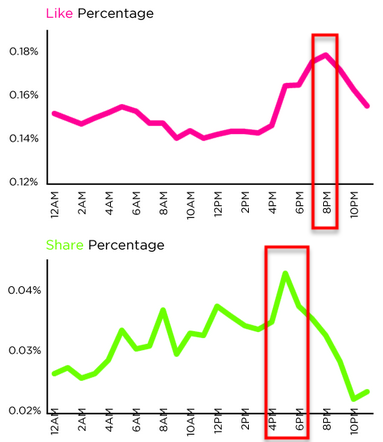
Best time of day is around 6 to 8 pm
Facebook users like and comment on content the most around 8 pm (local time), but share posts the most around 5 pm (local time).

Check out the rest of the infograph at Dan’s blog.
Does this jibe with what you’ve experienced on Facebook?John Haydon delivers social web strategy solutions for “the quick, the smart, and the slightly manic.” Curious? Then visit the John Haydon blog, follow him on Twitter or leave a comment.
 This work is licensed under a Creative Commons Attribution-NonCommercial 3.0 Unported.


Thanks for the stats, they are very useful especially the right time to post on Facebook, not sure if you have stats for Malaysian Facebook users?
http://goo.gl/7fNWJ