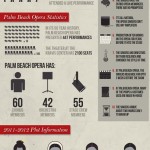
Find out why info graphics and data visualizations are helping organizations tell their stories and showcase their statistics by using colorful graphics and compelling story lines.
sharing center
Little Bird: New social tool helps identify potential supporters
Photo by Randi Deuro on Flickr (CC BY) New social tool helps organizations identify top influencers Target audience: Businesses, brands, digital marketers, advertising agencies, SEO specialists, entrepreneurs, educators, journalists, Web publishers. Social media has changed not only marketing but search. Today, you need to know who are the top influencers in your sector before you […]
Understand WordPress tags and categories
WordPress users are often confused when it comes to differentiating between categories and tags. Learn the difference between the two, plus find out how to create effective tags and categories on your own blog.
Media innovations from Europe coming to Stanford
A work by Elina Brotherus included in the exhibit, “Ars Fennica: Finnish Art Now.” Overseas projects to focus on mobile, data, journalism On Monday I’ll be heading to Stanford University to help judge News Pioneers: Media innovations from Europe. The participating teams are in different stages in their projects or start-ups. A few already have […]
Tools for e-advocacy: Resources for cause campaigns
Advocacy organizations often encourage their grassroots supporters to influence politicians. Here we look at a number of ways eAdvocacy has taken over traditional routes to create the largest impact.


