Making data visualizations – A survival guide from vis4 Avoid 3D charts, extend bar charts to zero & other key tips Target audience: Data designers, metrics and analytics experts, nonprofits, cause organizations, foundations, NGOs, social enterprises, businesses, educators, journalists, general public. Guest post by Beth Kanter Beth’s Blog Earlier this year at the Packard Foundation, […]
data visualization
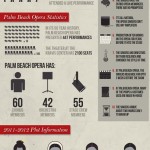
Infographics: Not your grandmother’s pie chart
Find out why info graphics and data visualizations are helping organizations tell their stories and showcase their statistics by using colorful graphics and compelling story lines.
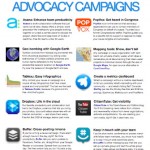
10 top tools for cause campaigns
A visualization from Bigthink.com. Target audience: Cause organizations, NGOs, nonprofits, foundations, social enterprises, political reformers, educators, journalists, general public. Over the past three years, as regular readers know, Socialbrite has put together dozens of guides and compilations of resources and tools for social change advocates. See the bottom of this article for a few, and […]


