Find out how to post smart and successful Facebook Page updates for your organization. Pagemodo’s visually stimulating info graphic helps shed some light on the process of posting for your audience.
infographics
Five tips to create powerful infographics
When you tell the story of your cause, you need to show how supporters ultimately create the outcomes. Infographics can be an effective way to tell your story in an easy-to-understand format. Check out our five tips for creating powerful infotgraphics.
10 top tools for cause campaigns
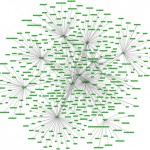
A visualization from Bigthink.com. Target audience: Cause organizations, NGOs, nonprofits, foundations, social enterprises, political reformers, educators, journalists, general public. Over the past three years, as regular readers know, Socialbrite has put together dozens of guides and compilations of resources and tools for social change advocates. See the bottom of this article for a few, and […]
6 ways to tell your stories with data
Data is the new black. These days everyone is releasing it, visualizing it, aggregating it, and mashing it up. And for good reason. Data is so much more than a stack of numbers or a server filled with client outputs. It can justify the work that your organization is doing, help others understand why it is critical, and offer exciting new ways to motivate others to help solve the problems your organization is working on.
How nonprofits should use infographics
Figures, properly used, can help tell your organization’s story Target audience: Nonprofits, NGOs, cause organizations, Web designers, Web publishers, brands, educators. Infographics are multiplying like rabbits. I run across them everywhere, and about all types of subjects from the power of social fundraising to what it takes to be an entrepreneur. Some are great, some […]


